Greetings From Faraway
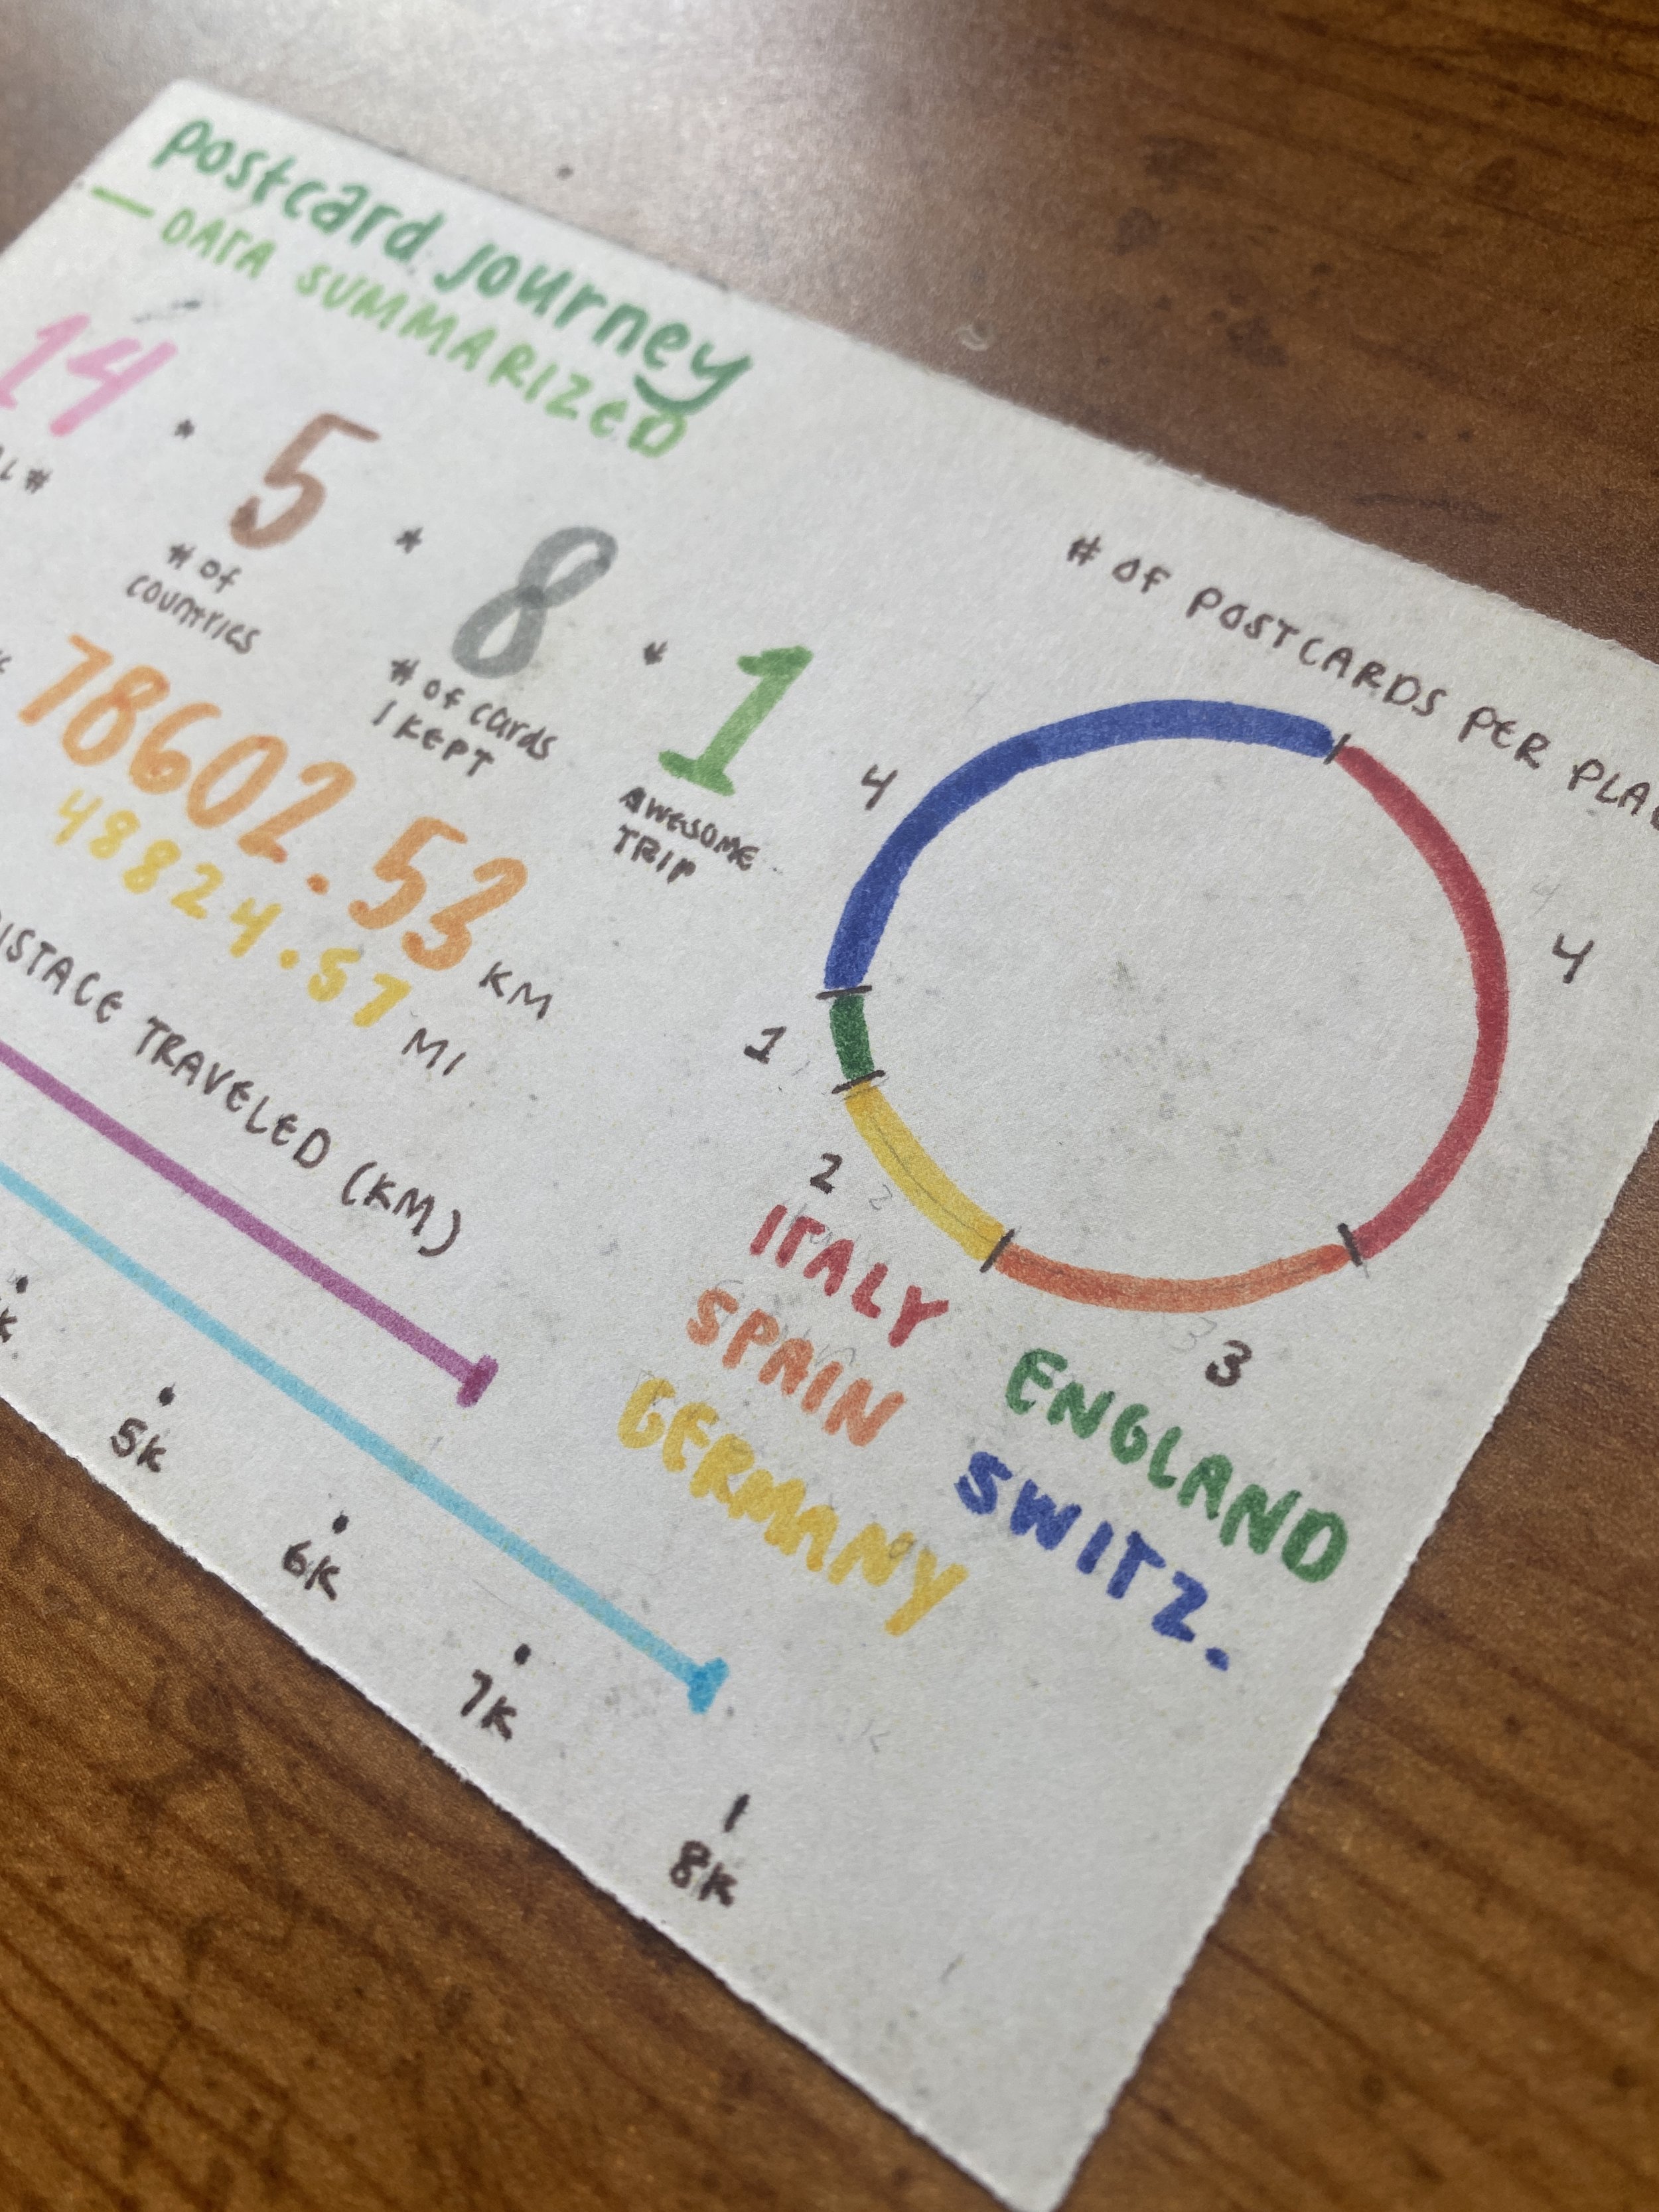
A mini data visualization project focusing on the fourteen postcards sent during September. During this time away from home, I sent postcards from six different countries to the East Coast of the United States.
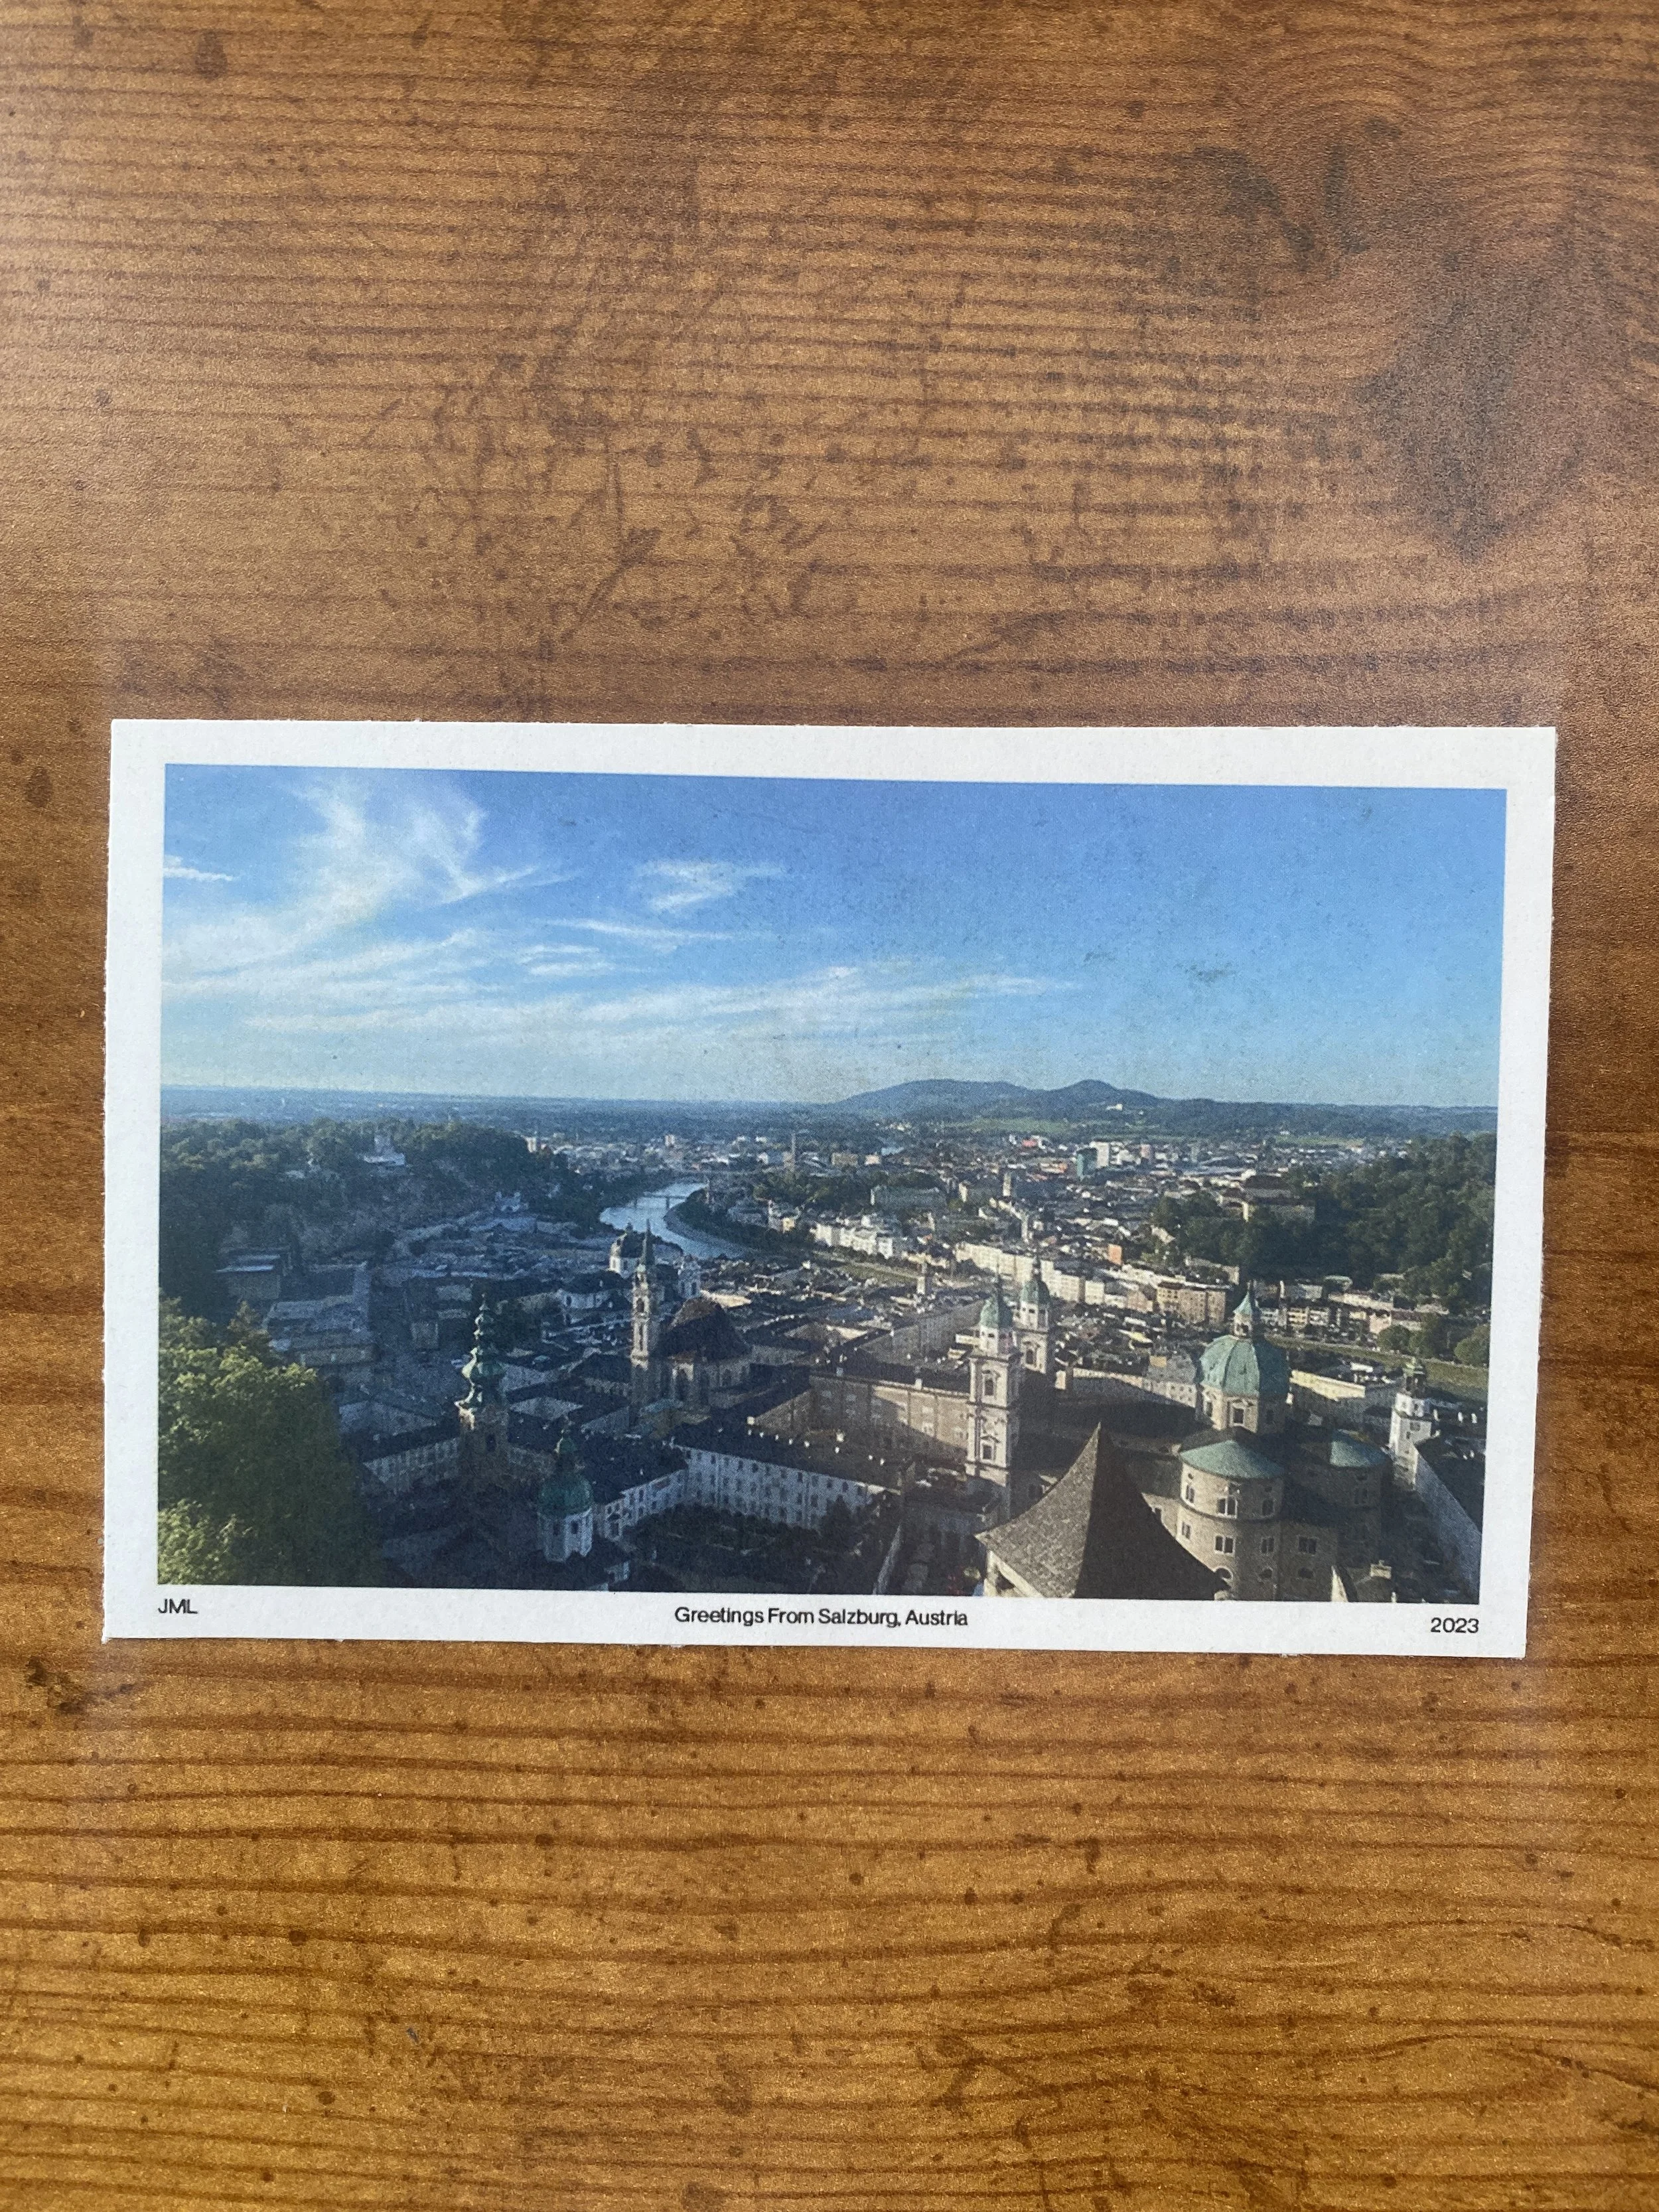
I spent a few days gathering the data. This started by making a spreadsheet of all the postcards and where they were sent from (not the country they were purchased from, but the country I went to the post office and physically mailed them). For example, a postcard was purchased and written in Salzburg, Austria, but it wasn't sent until I was in Venice. This affects the appearance of the data as well as assumptions drawn about where I traveled.
Each postcard I made is meant to look scuffed and well-worn, just like the postcard I used for inspiration. Enjoy!

Setting up the Data
First, I created an Excel Sheet with all of the most important information: Where the postcards were sent and received, along with the distance each traveled. Afterward, I sketched out all the other data to visualize, along with the color coding for each of the fourteen postcards.


Vintage postcard used for inspiration

Back of vintage postcard

Wear and tear on the back of the vintage postcard

All three postcard designs printed

Back of postcard designs, blank, to show the "wear and tear"

Close up of the bottom of each postcard

All three postcards together